# Understand Repository Scan Results
Once a repository scan completes, results appear on the **Repositories** tab and on the repository detail page. These results reflect **existing code**: open quality issues across the full codebase, not just recent PR changes.
This guide covers how to read scores, triage findings, and spot hotspots.
## Repositories overview
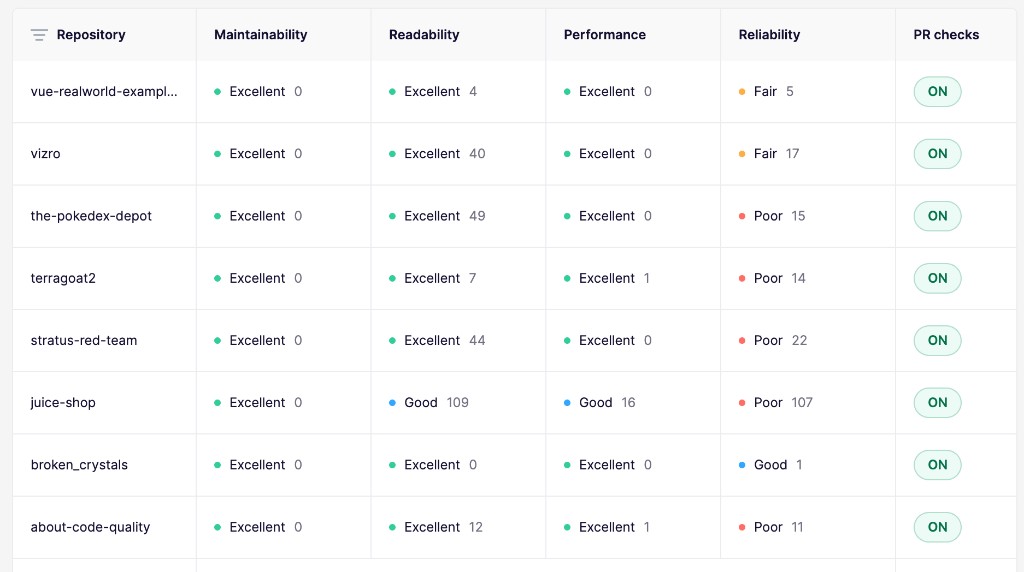
The **Repositories** tab lists every connected repository with a score in four categories:
* **Maintainability:** How easy the code is to change and extend
* **Readability:** Clarity, naming, and structure
* **Performance:** Efficiency and resource usage
* **Reliability:** Correctness, error handling, and bug-prone patterns
Each cell shows a rating label, a color indicator, and a number. The label reflects the worst-severity open finding in that category; the number is the total count of open findings there.
The **PR checks** column shows whether [PR checks](https://help.aikidogov.us/code-quality/code-quality-setup) are enabled for that repository (**ON** / **OFF**). PR checks cover **new code** on pull requests; repository scans cover **existing code** in the full repo. The two are independent, so you can enable either or both.
Click a tracked repository to open its detail page.
## Category ratings
Each category rating is based on the **highest-severity open finding** in that category, not the total issue count.
| Rating | Condition |
| ------------- | ------------------------------------------------------------ |
| **Excellent** | Only low or informational findings (nothing medium or above) |
| **Good** | At least one medium finding, but no high or critical |
| **Fair** | At least one high finding, but no critical |
| **Poor** | At least one critical finding |
Findings are grouped into categories based on the rule that triggered them. Each default and custom check belongs to one of the four categories above. Low-severity findings don't affect the rating label, but they are included in the issue count.
## Trend over time
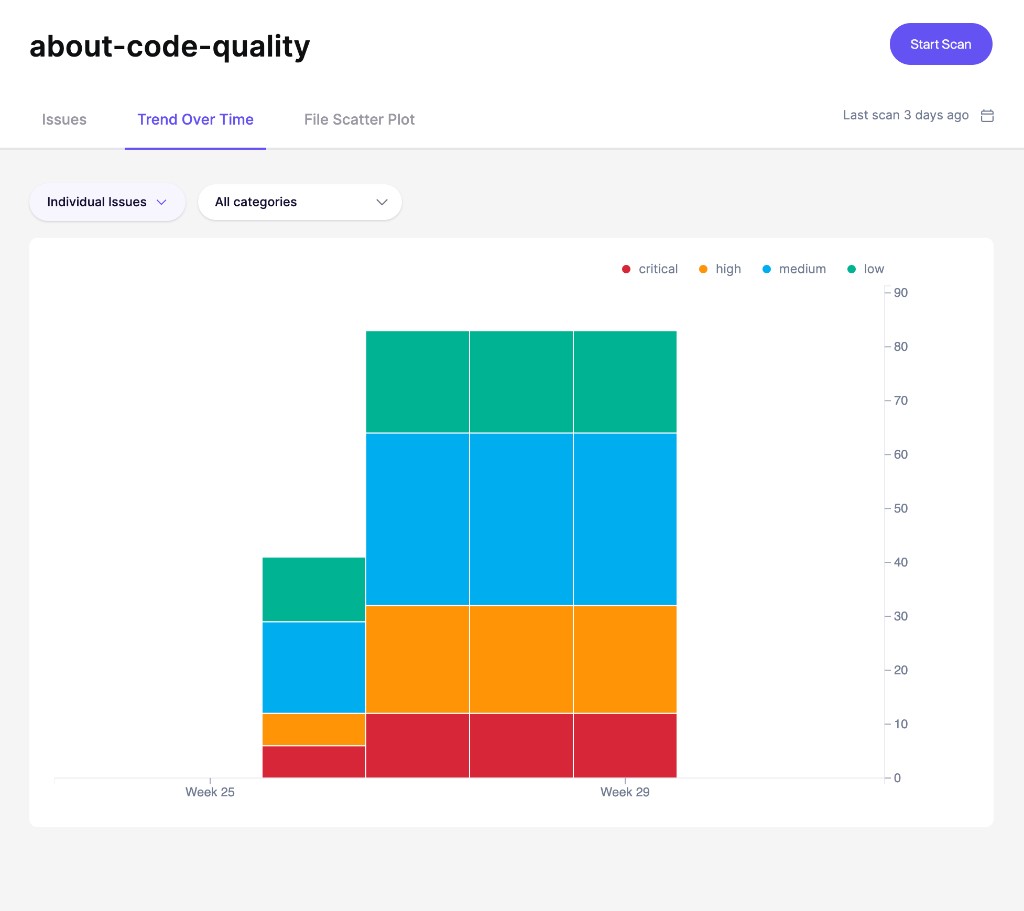
Open the **Trend Over Time** tab on a repository detail page to see how its open findings change from week to week.
The chart splits findings by severity, so you can see whether critical, high, medium, or low-priority quality debt is growing or shrinking. Use it to measure the impact of cleanup work and identify regressions that need attention.
## Issues tab
The **Issues** tab on the repository detail page lists every open finding, grouped by rule. Each row shows:
* **Type:** The language of the affected file
* **Name:** The rule title and affected file(s)
* **Severity:** The highest severity in the group
* **Location:** File path(s) where the issue occurs
* **Fix time:** Estimated effort to resolve
Click a row to open the detail sidebar. From there you can:
* Read the **TL;DR** and **How do I fix it?** guidance
* Browse **Subissues** with file names, line numbers, and code snippets
* Open **View code analysis** for a deeper look at a specific occurrence
* Ignore individual findings
### Fix findings with AutoFix
Aikido can generate the change for you. [AutoFix](https://help.aikidogov.us/autofix-and-remediation/overview-aikido-autofix) produces a fix for the finding and can open a pull request with the change, so you review and merge it.
To have Aikido open those pull requests on a daily schedule, turn on automatic creation for **Code Quality Issues**. It covers critical and high severity findings on default checks. See [Automatic Creation of Pull Requests](https://help.aikidogov.us/autofix-and-remediation/automation-and-merging/automatic-creation-of-pull-requests).
## File scatter plot
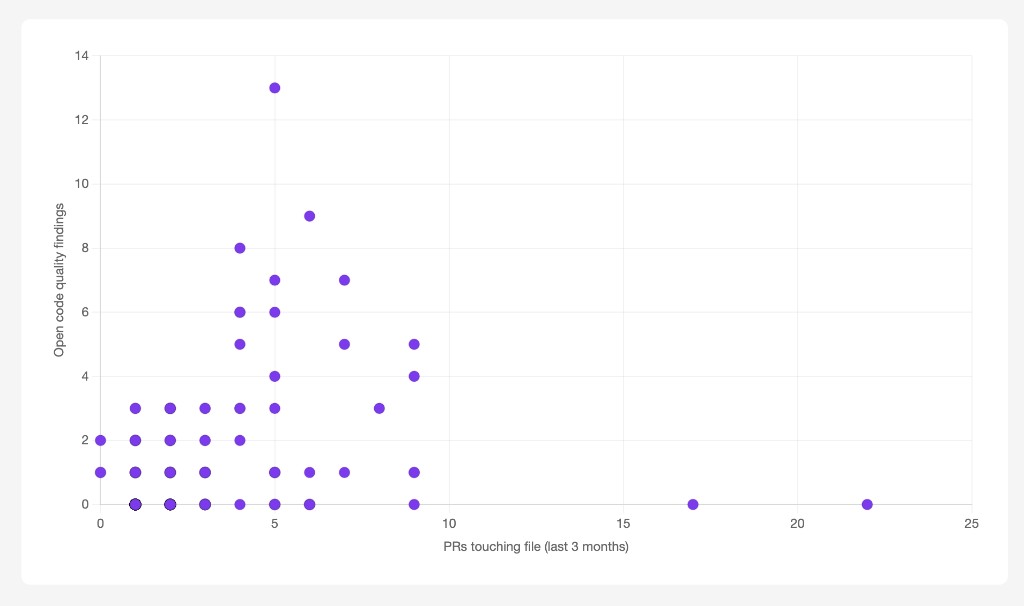
Switch to the **File Scatter Plot** tab to visualize code quality hotspots: files that are both frequently changed and carry open quality debt.
Each dot represents one file in the repository:
* **X-axis:** Number of PRs that touched the file in the last 3 months
* **Y-axis:** Number of open code quality findings in that file
Files in the **top-right** of the chart are your hotspots: high activity combined with low quality. Prioritize these when planning refactors or cleanup work.
{% hint style="info" %}
The scatter plot requires **both** modes enabled for the same repository: [PR checks](https://help.aikidogov.us/code-quality/code-quality-setup) for **new code** activity data, and repository scans for **existing code** finding counts.
{% endhint %}