
Understand Repository Scan Results
Read category scores, track trends, browse open findings, and use the file scatter plot.
Once a repository scan completes, results appear on the Repositories tab and on the repository detail page. These results reflect existing code: open quality issues across the full codebase, not just recent PR changes.
This guide covers how to read scores, triage findings, and spot hotspots.
Repositories overview
The Repositories tab lists every connected repository with a score in four categories:
- Maintainability: How easy the code is to change and extend
- Readability: Clarity, naming, and structure
- Performance: Efficiency and resource usage
- Reliability: Correctness, error handling, and bug-prone patterns
Each cell shows a rating label, a color indicator, and a number. The label reflects the worst-severity open finding in that category; the number is the total count of open findings there.
The PR checks column shows whether PR checks are enabled for that repository (ON / OFF). PR checks cover new code on pull requests; repository scans cover existing code in the full repo. The two are independent, so you can enable either or both.
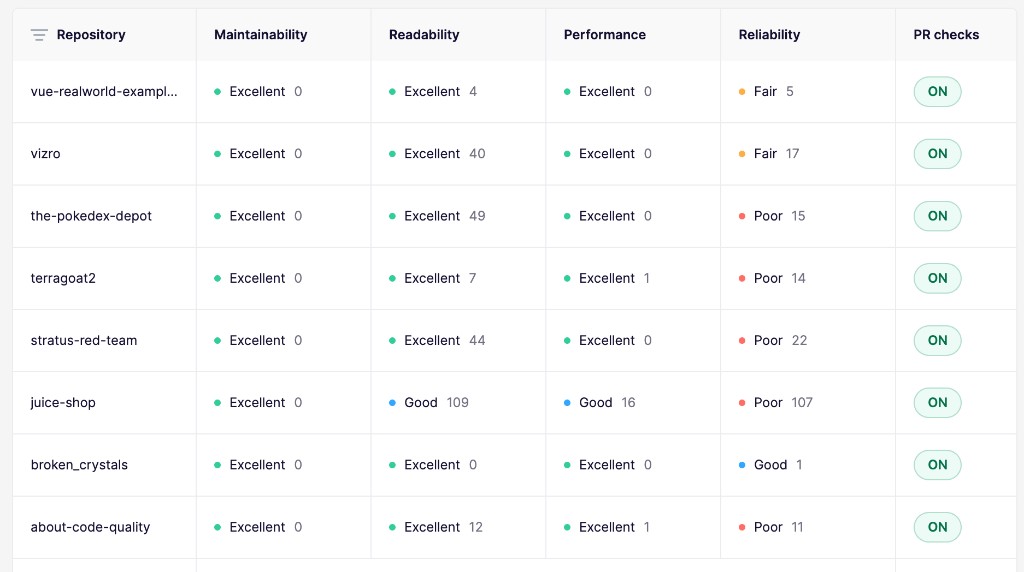
Click a tracked repository to open its detail page.
Category ratings
Each category rating is based on the highest-severity open finding in that category, not the total issue count.
| Rating | Condition |
|---|---|
| Excellent | Only low or informational findings (nothing medium or above) |
| Good | At least one medium finding, but no high or critical |
| Fair | At least one high finding, but no critical |
| Poor | At least one critical finding |
Findings are grouped into categories based on the rule that triggered them. Each default and custom check belongs to one of the four categories above. Low-severity findings don't affect the rating label, but they are included in the issue count.
Trend over time
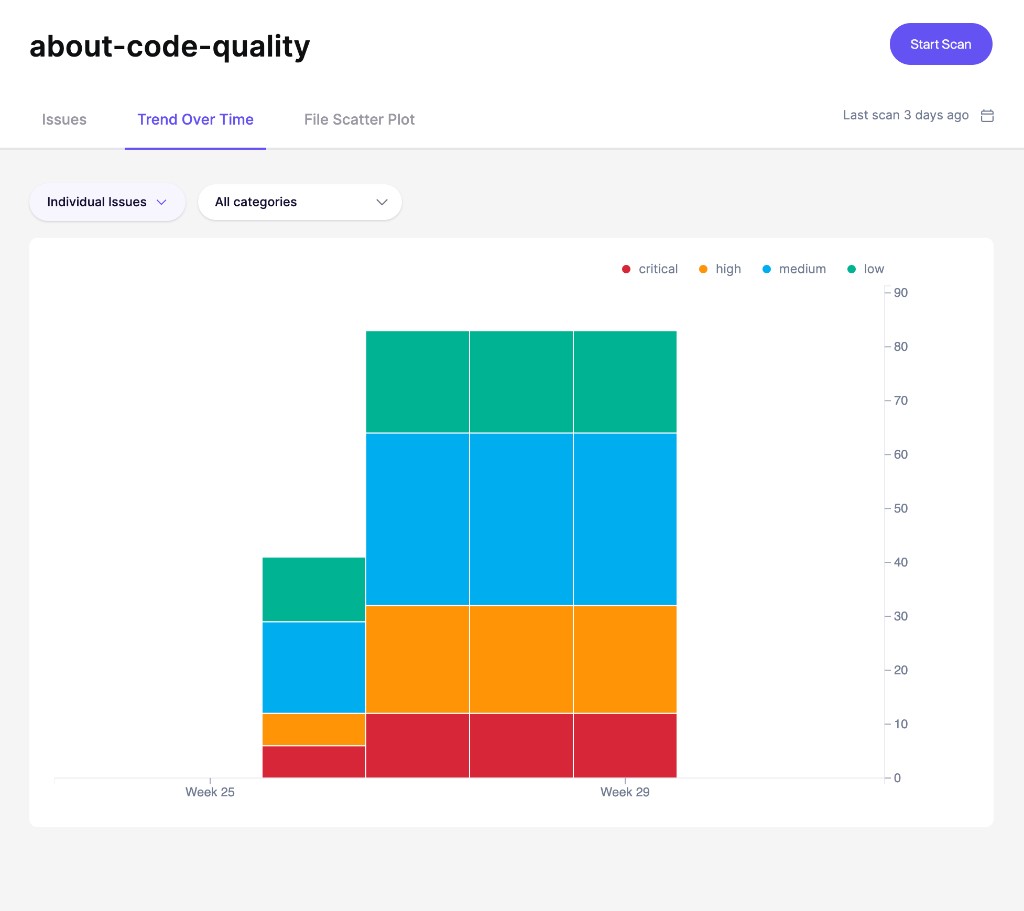
Open the Trend Over Time tab on a repository detail page to see how its open findings change from week to week.
The chart splits findings by severity, so you can see whether critical, high, medium, or low-priority quality debt is growing or shrinking. Use it to measure the impact of cleanup work and identify regressions that need attention.
Issues tab
The Issues tab on the repository detail page lists every open finding, grouped by rule. Each row shows:
- Type: The language of the affected file
- Name: The rule title and affected file(s)
- Severity: The highest severity in the group
- Location: File path(s) where the issue occurs
- Fix time: Estimated effort to resolve
Click a row to open the detail sidebar. From there you can:
- Read the TL;DR and How do I fix it? guidance
- Browse Subissues with file names, line numbers, and code snippets
- Open View code analysis for a deeper look at a specific occurrence
- Ignore individual findings
Fix findings with AutoFix
Aikido can generate the change for you. AutoFix produces a fix for the finding and can open a pull request with the change, so you review and merge it.
To have Aikido open those pull requests on a daily schedule, turn on automatic creation for Code Quality Issues. It covers critical and high severity findings on default checks. See Automatic Creation of Pull Requests.
File scatter plot
Switch to the File Scatter Plot tab to visualize code quality hotspots: files that are both frequently changed and carry open quality debt.
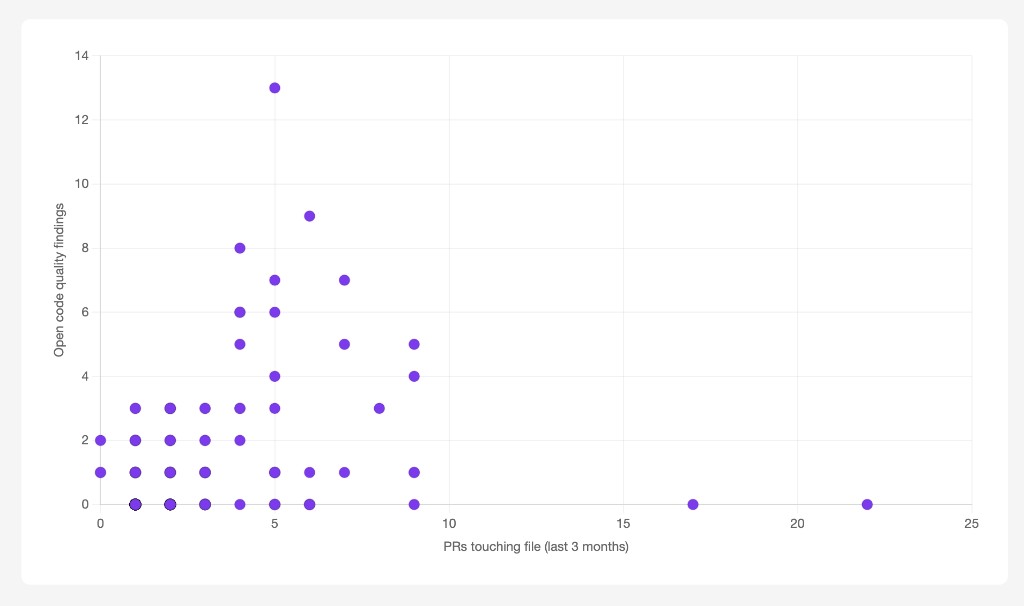
Each dot represents one file in the repository:
- X-axis: Number of PRs that touched the file in the last 3 months
- Y-axis: Number of open code quality findings in that file
Files in the top-right of the chart are your hotspots: high activity combined with low quality. Prioritize these when planning refactors or cleanup work.
The scatter plot requires both modes enabled for the same repository: PR checks for new code activity data, and repository scans for existing code finding counts.